 Coingecko
 combines crypto market data for price comparisons and asset tracking
Coingecko brings together crypto prices, market capitalization and trading volume so you can compare assets across the exchanges it tracks. Its charts show historical changes, while market listings identify where trading takes place. A useful comparison starts with the same asset, reporting currency and time window. Portfolio tools support ongoing monitoring, and the API supplies data for spreadsheets and applications. Each view answers a different question: an aggregated price describes a market, a trading pair identifies the two assets exchanged in a market and a portfolio describes recorded holdings. Coverage, available history and supply information determine how much each comparison can tell you.
Key takeaway: An aggregated crypto price supports market comparisons, while supply figures, trading liquidity and data coverage determine what that comparison can establish.
Market coverage and the meaning of a price
Coingecko calculates an aggregated price from exchange trading pairs after processing their data and removing outliers. Its final calculation uses a volume-weighted average of the remaining prices. That approach gives a broader reference than one exchange quotation. Coverage still matters: the result reflects the markets included in the calculation. Category views group assets for comparisons using market capitalization and volume. These groupings help organize research, although category membership alone says little about an asset’s liquidity or economic design.
Matching asset records before comparing numbers
Asset identity comes before price comparison because names and ticker symbols can overlap. For a token, the network and contract address distinguish the relevant record. A native coin may not have a token contract. The API also uses coin IDs to identify listed assets. These identifiers serve different purposes, so a ticker alone is a weak basis for joining records across applications.
Use these conditions when deciding whether a comparison is ready:
- Continue when the asset identity matches across the records, including its network and contract where applicable.
- Compare values only when their reporting currencies and measurement periods match.
- If a required value is missing, leave the comparison incomplete rather than treating the blank as zero.
- If a timestamp is too old for the task, wait for refreshed data before drawing a time-sensitive conclusion.
- Stop combining records when their identifiers describe different assets, even if their names match.
Why can the displayed price differ from a trade?
A displayed aggregate can differ from an executable trade because each venue has its own orders, liquidity and update timing. The spread is the gap between buying and selling quotations. Order book depth describes the orders available at different prices. A larger order can consume several price levels, so its average execution price can differ from the first quotation. Trading fees also affect the final amount, and their basis comes from the venue handling the trade.
Exchange comparisons therefore need more than reported volume. Trust Score evaluates spot exchanges using liquidity, cybersecurity, regulation, incidents and proof of reserves. Its liquidity assessment considers volume consistency and order book depth. The exchange score reflects relative standing among evaluated exchanges; it does not insure deposits or promise execution at a displayed price. An individual trading pair can have different liquidity from the exchange’s broader market activity.
Supply figures and relative asset size
Market capitalization puts a unit price in the context of circulating supply. Coingecko calculates an asset’s market capitalization by multiplying its price by its circulating supply. Either input can change the result. A low token price therefore does not, by itself, establish a small valuation.
Supply definitions
Circulating supply
Circulating supply estimates the units available in public circulation. Locked allocations can fall outside that figure, depending on their treatment under the supply methodology. The amount need not equal every token that the contract has created. Supply information therefore affects comparisons even when the price data matches.
Total supply
Total supply includes existing tokens beyond those currently circulating and excludes burned tokens. Maximum supply, where defined, describes a separate limit on issuance. These fields should retain their labels when copied into a spreadsheet; substituting one for another changes the meaning of the calculation.
Valuation limits
Fully diluted valuation, or FDV, applies the current price to total supply in Coingecko’s calculation. It helps show the difference between circulating and total supply at that price. It does not predict the price when locked tokens become available, nor does it specify their release schedule.
Market capitalization also differs from money invested or money available to withdraw. Applying a marginal trading price to the circulating supply produces a valuation. It does not establish that buyers would purchase the entire supply at that price. Liquidity remains a separate question.
Historical charts and comparable time windows
Historical comparisons need matching dates and sampling intervals because a daily observation cannot show every movement within that day. Price, market capitalization and volume describe different measurements, even when they share timestamps. Candlestick charts add open, high, low and close prices for each interval. Those boundaries matter when comparing candles with another dataset or a saved price observation.
The historical API returns timestamped data, with granularity governed by the endpoint, requested range and available plan options. Broader ranges can use coarser intervals. Available history also varies by asset and access level. A chart’s first observation marks the beginning of that dataset, which may differ from the asset’s launch. Analyses that select only assets listed today also leave out assets absent from that selection, so the selection rule matters when interpreting historical performance.
Saved portfolios and price alerts
Portfolio tracking keeps selected assets together and can display positions entered manually. Quantities and transaction records determine the personal performance figures; a watchlist by itself supplies no purchase history. Mobile price alerts notify users when a listed asset reaches a chosen price threshold. They support monitoring without requiring continuous attention to a chart.
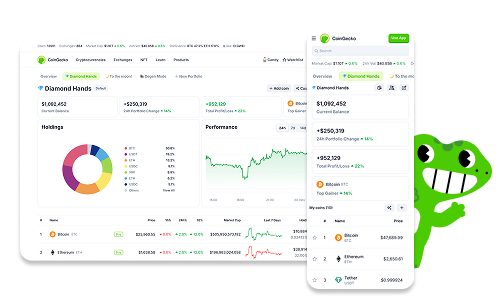
Wallet Tracking provides another entry path: a public wallet address supplies onchain holdings for supported networks. This feature reads public data without wallet connection, signing or spending approval. Available performance metrics depend on supported tokens, while wallet limits depend on the plan. Coverage should therefore match the holdings being monitored. Pasting an address shares that public identifier with the tracking service, even though it grants no authority to move funds.
Pool data and local trading conditions
Onchain data describes tokens and individual pools on supported decentralized exchanges, where a pool holds assets used for trading. Pool-level trades, liquidity and candles answer questions that an aggregate coin price cannot resolve. The network, token address and pool identity define the record. A missing verified market capitalization can coexist with available price data; fully diluted valuation remains a different metric. This distinction matters when comparing a recently tracked token with an asset that has established supply information.
Automated access and usage costs
The API supplies structured data when repeated comparisons need more than a browser view. An integration needs the relevant identifiers, requested fields and access that covers those requests. Free and paid access have different limits and feature availability. Subscription requirements depend on the needed endpoints, historical depth and request capacity. Refresh frequency and the number of separate requests determine how quickly an application consumes its allowance.
Batching supported queries and reusing recent responses can reduce repeated calls. Faster polling cannot create a new observation before the underlying data updates. Rate limits also apply to failed requests, so repeated errors can consume request capacity without producing usable data. An occasional comparison usually needs only the web interface. A spreadsheet or application gains more from automated access when it needs consistent fields and repeatable updates.
Things people ask about Coingecko
Can I deposit cryptocurrency into Coingecko?
Coingecko does not provide a trading account or wallet into which you can deposit cryptocurrency. Its portfolio displays track information about assets rather than holding those assets. Adding a position or tracking a public address does not transfer funds, create a deposit address or give the service custody of a balance.
Why does an asset show a price but no market capitalization?
A market capitalization can be unavailable when Coingecko lacks sufficiently reliable circulating supply information. Price data can still exist because exchanges report trades separately from supply records. A dash therefore does not mean the asset has no value, and replacing it with zero would misrepresent the missing information.
What does a trending coin ranking measure?
The trending coin list measures the popularity of user searches on Coingecko during its stated window. It measures attention rather than purchases, profitability or liquidity. A token can attract searches because of news or a sharp price movement, so trending status alone does not explain why interest increased.
Does trading volume show how much new money entered an asset?
Trading volume measures trading activity during a period rather than net money entering an asset. Each completed trade has both a buyer and a seller, and units can trade repeatedly. Volume can help describe activity, but it does not establish how much capital holders collectively added or removed.
Can an AI assistant retrieve Coingecko market data?
A compatible AI assistant can retrieve market data through Coingecko’s Model Context Protocol, or MCP, server. The free server uses shared limits, while authenticated access depends on the API plan. Tool calls can trigger multiple underlying API requests, so one natural-language question does not necessarily consume just one request.
Do Coingecko price alerts automatically buy or sell assets?
Coingecko price alerts send notifications rather than execute trades. An alert threshold identifies a price condition to monitor; it does not reserve that price or place an order. Any subsequent transaction uses the prices, liquidity and fees available through the service where the trade occurs.
How can incorrect project information be corrected?
Coingecko accepts project information corrections through its support and update request channels. A useful submission identifies the affected asset, the incorrect field and the evidence supporting the replacement. Project representatives should use an official correspondence address. Update requests also require a public verification post from an official social account linked to the project website. Publish the post before submitting the form, include its link in the request and then reply to the post with the Request ID received by email.